Quality of Life
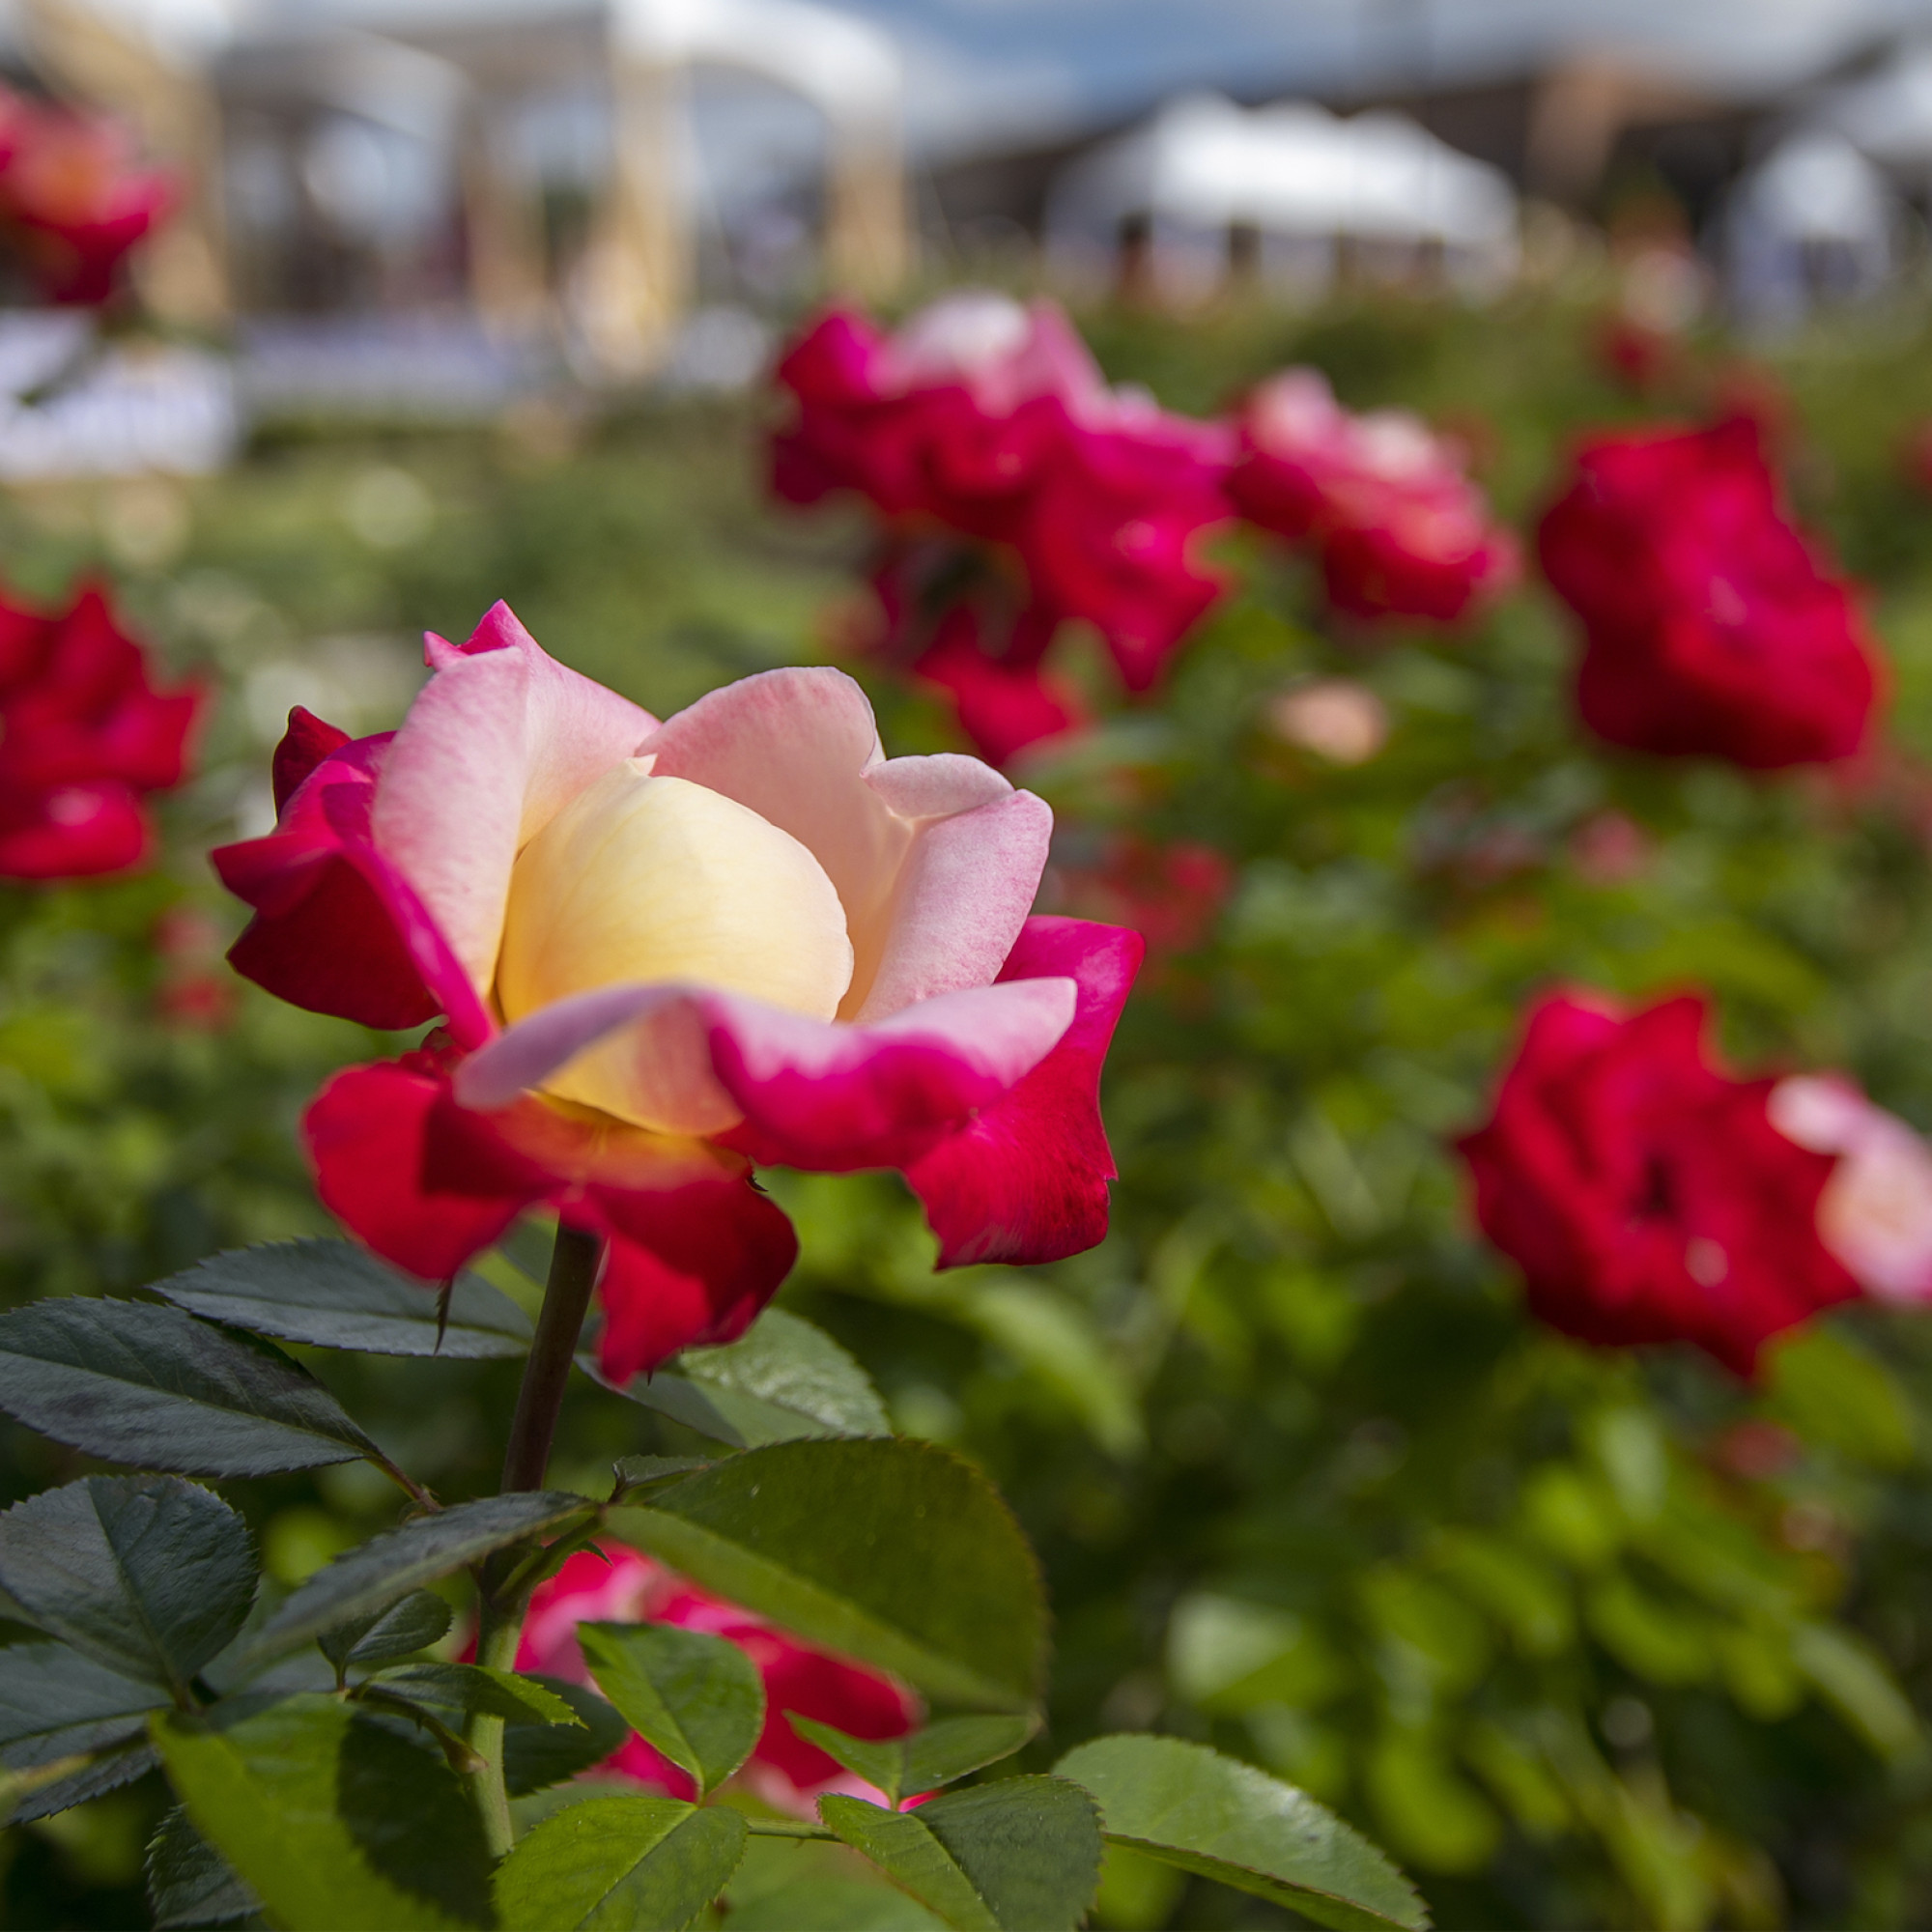
Stop & Smell the Roses.
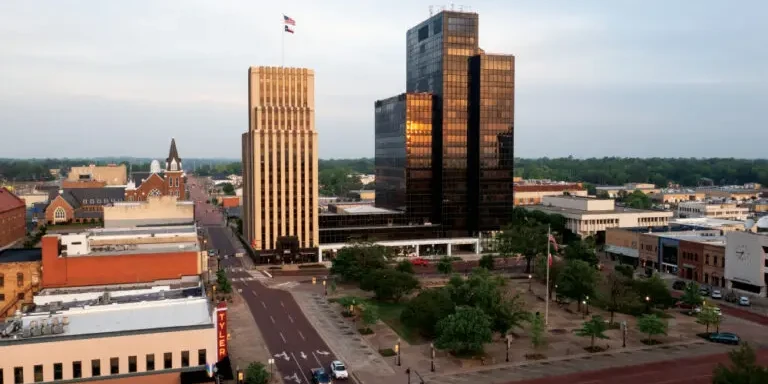
Tyler is known as the Rose Capital of the World. The weather is consistently mild, allowing residents and visitors to enjoy biking and walking through well-kept trails, water sports on one of three lakes, roaming through the nationally acclaimed Tyler Rose Garden, or exploring the walkable downtown for dining, coffee, street art, and shopping.
17th
Safest City in Texas
The 33rd largest city in Texas also ranks amongst one of the most family-friendly.
300+
Restaurants
From hole-in-the-wall, award-winning joints like Stanley’s BBQ to delicious franchises like Texas de Brazil, Tyler has it all.
28+
Parks
Tyler has 28 parks, 2 green spaces,14 walking/biking trails and a newly renovated zoo.
15:1
Student to Teacher Ratio
Tyler Independent School District ranks above average in every category.